


Ever wondered if a tiny code tweak could totally change how a game feels? Experts say it can. A single fix to a shader can smooth out the graphics and even speed up the game engine.
In this post, some seasoned pros share the tools and tricks they use to keep games running smoothly. They explain how using profiling routines early is like catching glitches before they turn into big problems.
Stick around to see how smart checks and regular system updates ensure your game stays as responsive as that awesome match you just won.
In-Depth Expert Perspectives on Game Engine Performance and Optimization
Profiling early with Unity’s Profiler is a total game-changer for devs. It checks out your game’s CPU, GPU, memory, and rendering on real devices so you can catch issues before they blow up. I mean, one dev even tweaked a single shader and slashed resource use by 12%, crazy, right?
Experts back up using cool tricks like vector AI (that’s smart coding to help game moves) and on-device advertising to sharpen performance tuning. Big industry milestones, like the Unreal Engine Service Partner news on March 28, 2025, and cross-platform UI tweaks on December 4, 2024, show how important it is to keep diagnostics on point. These stories aren't just hype, they set the stage for building game engines that can grow and handle loads more than just patchwork fixes.
Keeping an eye on frame rates, draw calls, and memory usage is like tuning up a high-performance race car before a big match. Regular profiling helps mix great visuals with smooth gameplay. It’s all about balancing that stunning look with rocket-fast responses during long sessions.
In truth, regular checkups and expert advice aren’t just extras, they’re must-haves. Devs should schedule profiling sessions all the time and tweak their techniques with new hardware trends. By watching all these performance clues closely, teams can keep games running smooth and responsive, just like your favorite ride in an epic battle.
Benchmark Assessment and Diagnostic Monitoring in Game Engine Optimization

Instead of running the same old profiling routine, try using clever diagnostic tricks that catch even the sneakiest issues. Rather than just glancing at CPU, GPU, and memory numbers, set up custom profiling right after you drop in big code changes. For example, block out specific time frames to catch any odd frame-time jumps. And here’s a fun fact: a single tweak to an AI routine can push frame times up by more than 15ms, leading to noticeable stutters during those intense moments.
Take a closer look at frame-time differences. Instead of just averaging numbers, log every spike to see what’s really happening during tough processing or scene shifts. Experiment with different timings, like running tests when the game feels most loaded, to truly understand its performance in various states.
Keep an eye on these key metrics to fine-tune your diagnostics:
| Performance Metric |
|---|
| CPU usage |
| GPU load |
| Memory allocation |
| Frame rate (FPS) |
| Frame-time variance |
| Draw call count |
Rendering Refinement and Frame Acceleration Techniques in Game Engines
Lowering texture sizes and using compressed formats helps cut down on extra work while keeping visuals crisp. Turning off extra post-processing effects lets the GPU focus on the big tasks so that even during busy scenes, the game runs smoothly. Changing quality options gives developers a way to balance pretty graphics with fast performance. Using simpler models or even flat images for distant objects means the engine only works hard on the important stuff. And occlusion culling skips drawing items hidden behind others, lightening the load.
Batching is another cool trick. By merging both static and moving parts of a scene and using texture atlases (big images that hold several small textures), the game spends less time on extra tasks and more time on pushing out frames quickly. Tweaking shaders, those little programs that make things look awesome, by cutting out needless math and drawing less than necessary speeds up things even more. One developer once said, "a tweak in shader compilation shaved off nearly 20 frames per second in crowded scenes," showing that even small changes can really count.
Putting these techniques together lets developers boost graphics quality without sacrificing speed. Every tweak, from using compressed textures to fine-tuning shaders, adds up to smoother, sharper gameplay. In the end, every frame really counts, blending eye-catching visuals with quick, responsive performance.
Memory Consolidation and Resource Scheduling Strategies

Managing your game’s memory properly is key to keeping things running smooth. One cool trick is to keep a close watch on every memory allocation, so you don’t get surprise slowdowns. For example, using object pooling (recycling game items instead of making new ones all the time) really cuts down on sudden memory spikes. And hey, if you load a new level, try calling Resources.UnloadUnusedAssets to clear out what you don’t need.
Resource scheduling is just as important. Think of it like planning your game moves: you want the most important tasks to happen without a hitch. Splitting up memory duties among different parts of your engine means everything flows just right. If your game’s running several background tasks, try to schedule them during quieter moments to keep the main gameplay zipping along.
Here are some quick strategies to boost performance:
- Keep an eye on every memory allocation
- Reuse assets with object pooling
- Clear out unused memory during level changes
- Put important tasks first
- Spread out memory use evenly
- Experiment with different scheduling techniques
Mixing these smart memory techniques with thoughtful resource scheduling helps cut down those pesky performance spikes. It lets your game run smoother even when the action gets intense, ensuring players enjoy a solid, lag-free gaming experience.
Algorithmic Improvement and Code Profiling for Execution Quickening
When you’re looking to speed up your game, skip the old diagnostic routines and try something fresh. A cool trick is to cache your key components so your game doesn’t waste time searching for them every frame. Think of it like saving your game progress, you grab your health bar reference once and reuse it, making things smoother.
You can also tweak your compiler settings and switch on SIMD (that’s a way to do several tasks in one go) to really boost performance. Adjusting your build flags can cut down on render time and ease the load on your GPU. For example, turning on SIMD helped ramp up scene rendering by about 10% during all the crazy action.
| Technique | Example |
|---|---|
| Caching Component References | “Cache your health bar instead of re-fetching it each frame.” |
| Compiler and Pipeline Tuning | “Enabling SIMD improved rendering speed by 10% in busy scenes.” |
Simulation Enhancement and Physics Dynamics Optimization

Tweaking your game's physics can seriously boost both realism and performance. Start by adjusting fixed timestep intervals, this sets how often the physics engine calculates simulations so that you get smooth motion without bogging down your game. For instance, you might set the timestep a bit higher during quieter scenes to free up resources for big action moments.
Using simple colliders like boxes and spheres is a smart move when you don't need super detailed collision shapes. Try switching out complex meshes with these simpler shapes, which cuts down on extra calculations while keeping collision detection believable. You can also disable physics calculations for objects that are off-screen to save processing power for what really matters during play.
Taking it further, implementing multithreaded physics lets different parts of the simulation run simultaneously, enhancing concurrency and reducing slowdowns. This is a neat trick to balance that fine line between realism calibration and performance speed. Imagine a busy level where every collision counts, a few tweaks in multithreaded handling can keep everything running smooth without sacrificing the detailed motion and collision resolution that make the experience feel real.
Comparative Case Studies and Efficiency Quantification
Some real-world examples prove that small changes can give your game a big boost. For example, one studio working on a Unity mobile game improved its frame rate by over 15 FPS in 2024. They cut down on draw calls by reworking the way they handled rendering. The game ran smoother, and players really felt the difference.
Another study from March 28, 2025, looked at an Unreal VR simulation that reduced its memory use by 30%. The team changed the way they loaded assets and added stricter checks on memory use. This smart move showed how tweaking memory management can lead to a huge win in VR experiences.
There’s also a cross-platform game that upgraded its UI framework on December 4, 2024. By optimizing script routines and using automated build workflows, they shaved off 20% of load times. This case reminds us that even updating the user interface can have a big impact on overall game performance.
These examples not only show measurable gains from performance tweaks but also provide great tips for developers with similar challenges. Sometimes, a little focused change in areas like draw calls, memory, or UI can lead to big savings in efficiency.
| Case Study | Engine | Performance Improvement |
|---|---|---|
| Unity mobile title | Unity | 40% reduction in draw calls, +15 FPS gain |
| VR simulation | Unreal | 30% better memory use |
| Cross-platform UI framework | Custom | 20% faster load times |
Developer Tool Recommendations and Build Workflow Automation
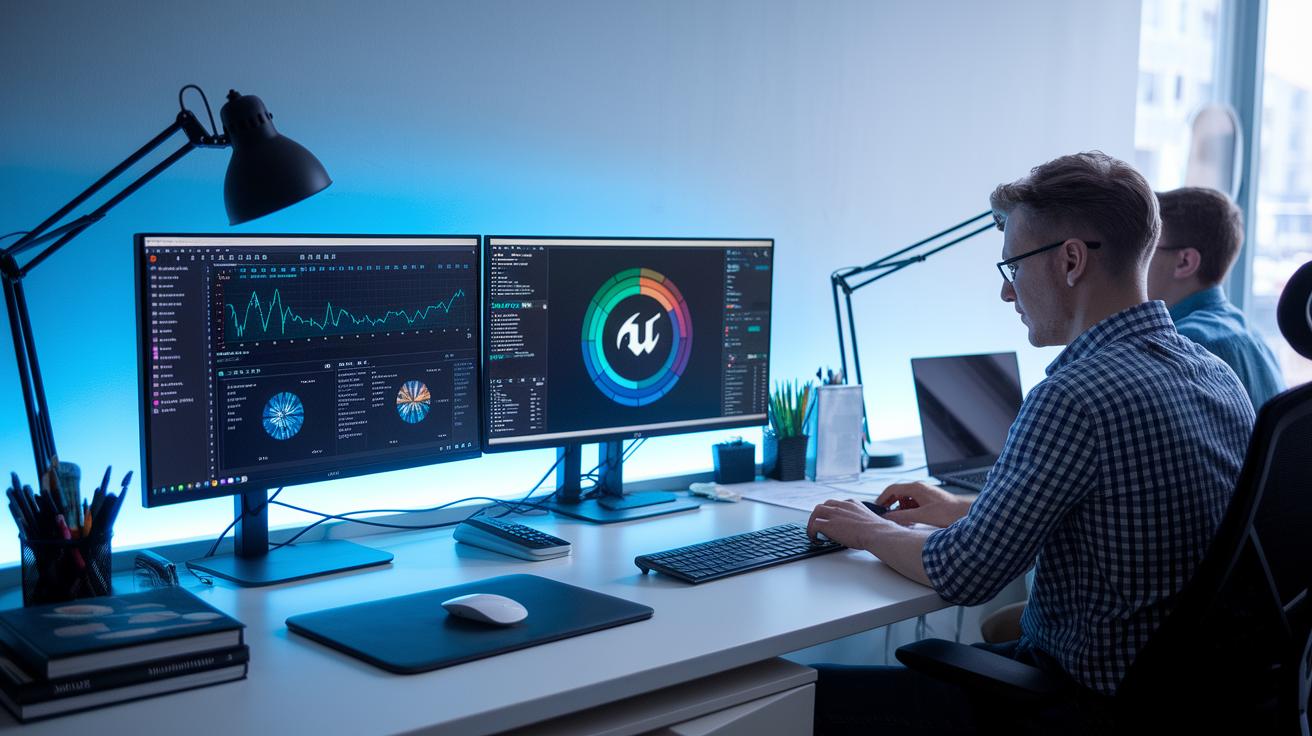
Start by adding cool tools like Unity Profiler and Unreal Insights into your build process. They help you find performance issues, whether it's weird memory spikes or a drop in frame rates. One developer said, "I set up automated tests that run the Unity Profiler after every change," which caught problems early and saved tons of debugging time.
Next, think about using custom tracing libraries to track performance on a very detailed level. Imagine having an automated script that kicks off diagnostic tests as soon as you push a new commit, it’s like having a trusty sidekick for your code! And setting up a build pipeline with CI/CD helps run key performance tests every time you update, so your builds stay smooth and fast.
You might also want to check out vector AI for asset optimization. This tool can offer smart suggestions like compressing textures or rearranging assets to speed up load times, as if it's giving your workflow an extra boost. Plus, with handy API references and community plugins, your whole build process moves effortlessly from one platform to another, leaving you more time to focus on making the gameplay feel tight and responsive.
Final Words
In the action: we’ve explored expert advice on game engine performance and optimization. We broke down everything from early profiling with Unity’s Profiler to rendering, memory management, and code tuning. The article even highlighted key metrics like CPU usage, GPU load, memory allocation, frame rate, frame-time variance, and draw call count. Each section provided clear strategies and practical examples. These expert insights on game engine performance and optimization aim to boost both gameplay quality and development skills. Keep pushing forward, game on, and enjoy the ride!
FAQ
What do expert insights on game engine performance optimization on Reddit reveal?
Expert insights on game engine optimization from Reddit reveal community-tested tips using early profiling tools like Unity Profiler and Unreal Insights, plus methods for benchmarking and refining graphics and memory strategies for smoother gameplay.
What is the best game engine for performance?
The best game engine for performance depends on your project. Many experts favor Unreal Engine 5 for high-end titles and Unity for smaller games, thanks to their strong profiling and optimization toolsets.
How are game engines optimized?
Game engines are optimized by profiling CPU, GPU, and memory usage, refining rendering strategies, streamlining code, and balancing physics calculations. This approach uses key metrics and diagnostic monitoring to close performance gaps.
How do I use Unity Profiler?
Using Unity Profiler starts by opening it from the Window menu. You record critical metrics like CPU usage, memory allocation, and frame times to spot bottlenecks and enhance overall game performance.
How can I optimize performance in Unreal Engine 5?
Optimize Unreal Engine 5 by using built-in profiling tools, adjusting graphics settings, and following courses that cover rendering refinement, memory management, and code profiling to achieve smoother and faster gameplay.
What is Unreal Insights?
Unreal Insights is a profiling tool that tracks engine performance, identifies bottlenecks, and analyzes frame metrics. It gives developers a clear view of system behavior, helping them fine-tune game performance.
What engine do most AAA games use?
Most AAA games use Unreal Engine 5, which offers robust optimization tools, advanced rendering capabilities, and detailed diagnostic features to handle complex projects while maintaining smooth performance.